Tempature and Other

Chart 1 explains the maximum and minimum temperature in Riga during the 12 months of the year, it explains about the physical characteristics. The month that it is the highest is July and the month that it is the lowest is January.

Chart 2 shows the precipitation which is also a physical characteristic of Riga, during the months it shows how much precipitation (in mm). February is the driest months and the wettest months are july and august.
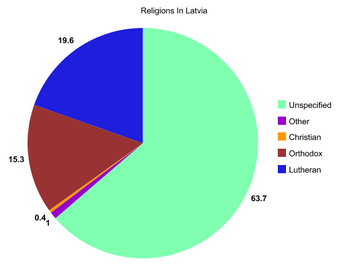
Chart 3 shows the different religions in Latvia, which is a human characteristic and apart of the culture there. The 63.7% are unspecified, 15.3% are orthodox, 0.4% christian, 19.6 lutheran and 1% other.
